![Altius Logo_Horz.png]](https://help.altius-group.com.au/hs-fs/hubfs/Altius%20Logo_Horz.png?height=35&name=Altius%20Logo_Horz.png)
Important Notes:
-
Demographic & Work Area groups are only available where the minimum reporting threshold of 10 responses is met to protect participant confidentiality. By default, Select All is applied, which includes all demographic groups, including those hidden from individual selection because they do not meet the reporting threshold.
- Risk Indices are calculated out of 100, factoring in the Exposure, Duration and Impact of the psychosocial hazard. Scores, on the other hand, are calculated out of 5, factoring in Exposure only. Further details on the formulas and reasoning behind these calculations can be found in the FAQs.
Overview: The 7 Dashboard Sections
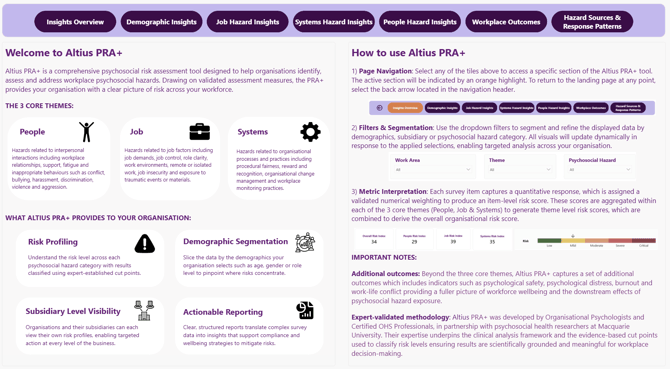
Section 1: Landing Page This section introduces the purpose of the dashboard and provides guidance on how to navigate and use it effectively to better understand your workforce. It provides background context on the underlying data powering the dashboard as well as the development methodology.
Section 2: Insights Overview
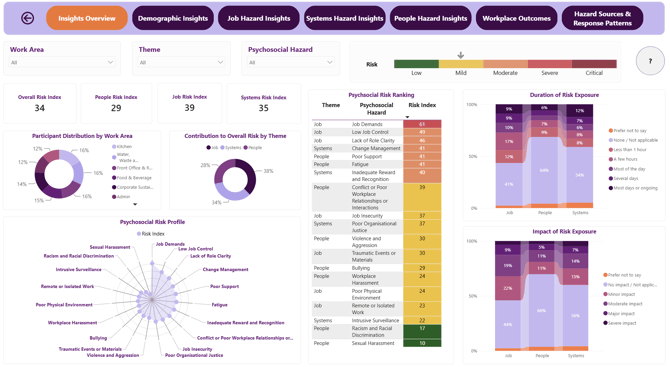
This section provides an organisational overview of the Altius PRA+ survey results, including the exposure, duration and impact of all psychosocial hazards. The results can be filtered by Work Area, Psychosocial Hazard and Hazard Theme. It also includes four risk indices, each scored out of 100, representing Overall Risk, People Risk, Job Risk and Systems Risk.
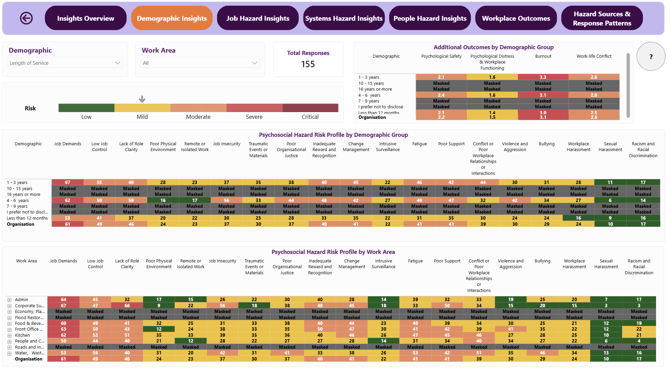
Section 3: Demographic Insights This section provides a demographic overview of the Altius PRA+ survey results. Risk Indices (scored out of 100) are calculated using the combined exposure, duration and impact scores for each psychosocial hazard. Additional Outcomes are calculated solely from exposure scores (scored out of 5).
The results can be filtered by Work Area and a single demographic category. This section includes three heatmaps:
- Two heatmaps display Risk Indices by demographic group at an organisational level (e.g. age group, gender) and by Work Area (e.g. Finance, Administration).
- The third heatmap displays Additional Outcomes by demographic group at the organisational level, based on exposure scores only.
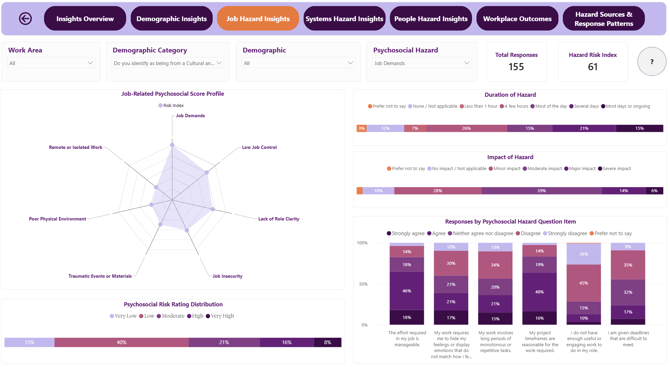
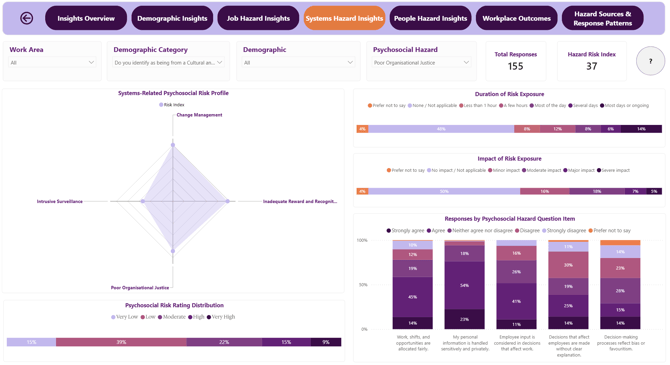
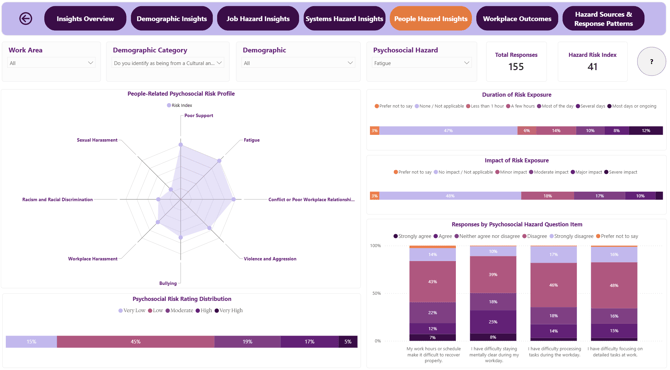
Section 4, 5 & 6: Job/Systems/People Hazard Insights These sections provides a detailed analysis of all the psychosocial hazards segmented by Theme. Results can be filtered by a single demographic category, with demographic groups only displayed where there are at least 10 responses to help protect participant confidentiality. Groups with fewer than 10 responses are included only within the All selection. Results can also be filtered by Work Area, with reporting restricted to top level Work Areas that meet the minimum reporting threshold of 10 responses.
The pages provide a detailed breakdown of each psychosocial hazard, including the individual survey questions associated with the selected hazard. Users can select one psychosocial hazard at a time to view its Exposure, Duration and Impact results. Exposure results are calculated excluding non-disclosed responses.
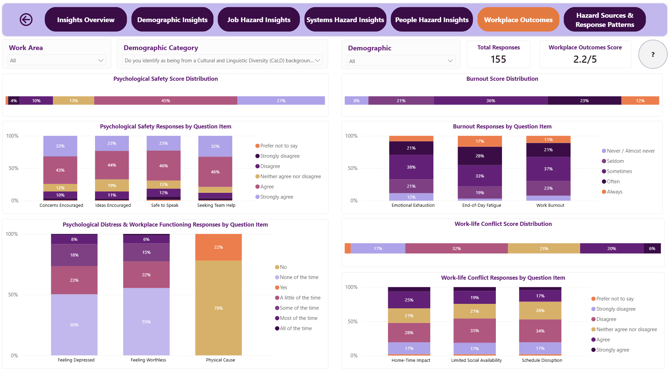
Section 7: Workplace Outcomes This section extends beyond the three core psychosocial hazard themes (Job, Systems and People) to provide insights into additional workforce wellbeing outcomes. These include indicators such as psychological safety, psychological distress, burnout and work–life conflict, offering a broader understanding of workforce wellbeing and the downstream effects of psychosocial hazard exposure.
Results can be filtered by top-level Work Area and demographic category, provided the minimum reporting threshold of 10 responses is met to protect participant confidentiality.
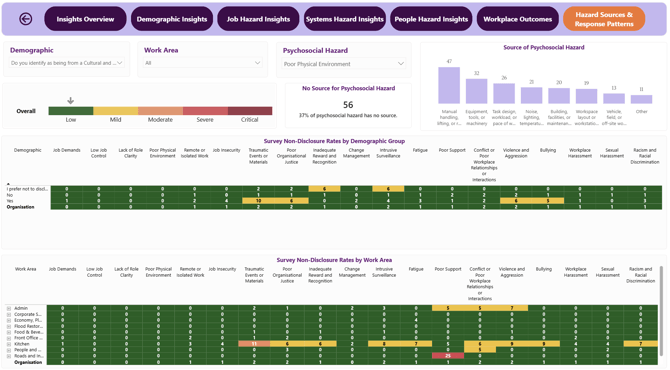
Section 8: Hazard Sources & Response Patterns This section provides insights into the sources of some of the psychosocial hazards and response patterns across the organisation. Hazard sources are captured using multiple-choice survey questions, allowing respondents to select more than one contributing source.
The section also includes two heatmaps displaying non-disclosure rates for each psychosocial hazard, segmented by Work Area and demographic category.
Non-disclosure rates are calculated as a percentage of total responses for each category and highlight areas where employees may not feel comfortable disclosing their experiences. Monitoring these rates can help identify potential barriers to psychological safety and inform targeted interventions.
Navigation
Use the page navigation bar at the top of the report to move between the eight sections of Altius PRA+ tool. Select any navigation tile to access the corresponding section, with the active section highlighted in orange. To return to the landing page at any time, select the back arrow located in the navigation header.

General Features
There are several features that are shared across majority of the dashboard.
Filters for Insights Overview

Work Area: Select one or more Work Areas to filter and segment the PRA+ survey results.
Theme: Select one or more Psychosocial Hazard Themes to filter and segment the data by.
Psychosocial Hazard: Select one or more Psychosocial Hazards to filter and segment the data by.
Filters for Demographic Insights

Demographic: Select a Demographic category to filter and segment the PRA+ survey results by.
Work Area: Select one or more Work Areas (up to 2 levels) to filter and segment the results from the Altius PRA+ survey.
Filters for Job/Systems/People Hazard Insights

Work Area: Select one or more Work Areas to filter and segment the PRA+ survey results.
Demographic Category: Select a Demographic Category to filter the PRA+ survey results by.
Demographic: Select one or more demographic groups to filter the PRA+ survey results by. Note: Demographic groups are only available where the minimum reporting threshold of 10 responses is met to protect participant confidentiality.
Psychosocial Hazard: Select one or more Psychosocial Hazards to filter the data by.
Filters for Workplace Outcomes
Work Area: Select one or more Work Areas to filter and segment the PRA+ survey results.
Demographic Category: Select a Demographic Category to filter the PRA+ survey results by.
Demographic: Select one or more demographic groups to filter the PRA+ survey results by. Note: Demographic groups are only available where the minimum reporting threshold of 10 responses is met to protect participant confidentiality.
Filters for Hazard Sources & Response Patterns:
 Work Area: Select one or more Work Areas (up to 2 levels) to filter and segment the results from the Altius PRA+ survey.
Demographic: Select a Demographic Category to filter the PRA+ survey results by.
Psychosocial Hazard: Select a Psychosocial Hazard to filter the PRA+ survey results by.
Insights Overview Key Metrics Explained
Overall Risk Index: A score, ranging from 0 to 100, that measures overall risk based on psychosocial hazards related to Job, People and Systems.
People Risk Index: A score, ranging from 0 to 100, that measures risk based on psychosocial hazards related to People.
Job Risk Index: A score, ranging from 0 to 100, that measures risk based on psychosocial hazards related to Job.
Systems Risk Index: A score, ranging from 0 to 100, that measures risk based on psychosocial hazards related to Systems.
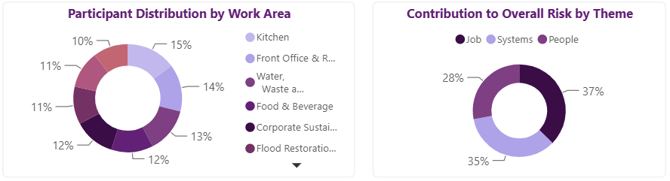
Participant Distribution by Work Area: Displays the breakdown of Altius PRA+ Survey participants across different Work Areas.
Contribution to Overall Risk by Theme: Shows how Overall Risk breaks down across the largest contributing themes (People, Job and Systems).
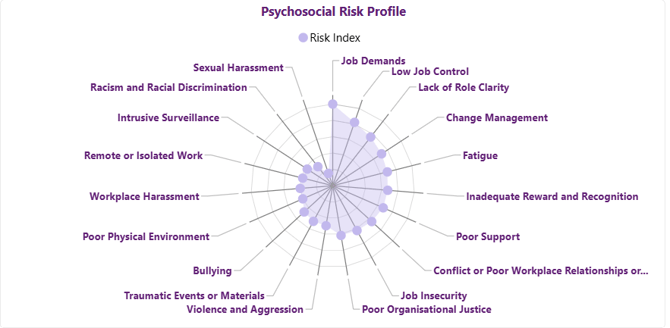
Psychosocial Risk Profile: A radar chart displaying all 19 psychosocial hazards, highlighting which ones pose the highest risk for your organisation.
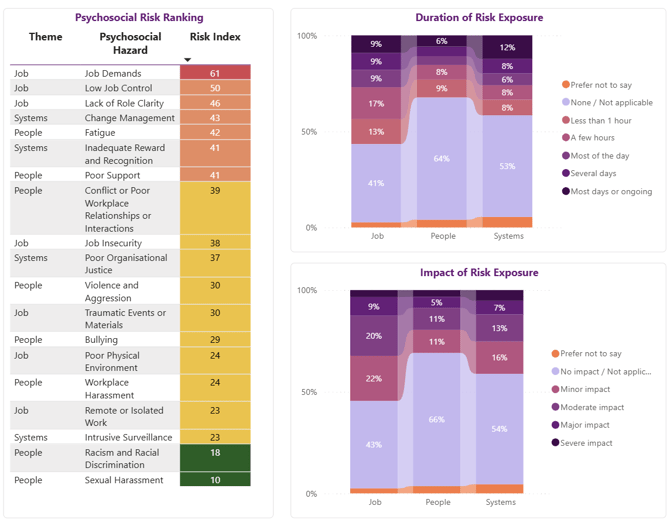
Psychosocial Risk Ranking: Lists all 19 psychosocial hazards along with their associated Theme, Risk Index and corresponding risk category.
Duration of Risk Exposure: Shows how long your work force have been exposed to the 19 psychosocial hazards, broken down by theme.
Impact of Risk Exposure: Shows the impact the 19 psychosocial hazards have had on your workforce, broken down by theme.
Key Metrics for Demographic Insights Explained
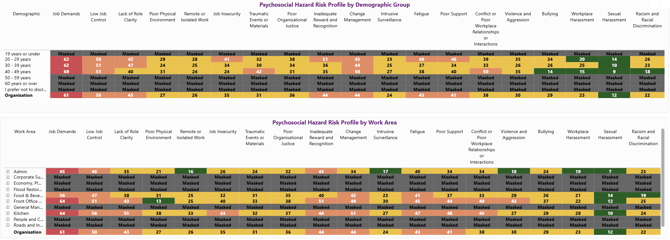
Psychosocial Hazard Risk Profile by Demographic Group: A heatmap displaying all 19 psychosocial hazards segmented by the selected demographic category. Groups with fewer than 10 responses are masked to protect individual privacy.
Psychosocial Hazard Risk Profile by Work Area: A heatmap displaying all 19 psychosocial hazards segmented by the selected work areas within your organisation. Work Areas with fewer than 10 responses are masked to protect individual privacy.
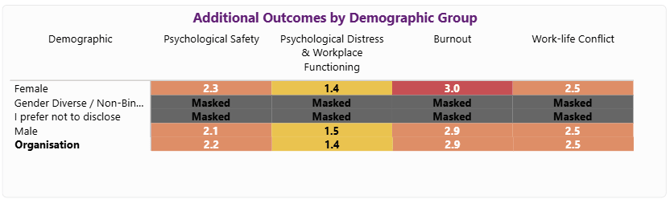
Additional Outcomes by Demographic Group: A heatmap displaying selected additional outcomes for your organisation, segmented by the chosen demographic category. Groups with fewer than 10 responses are masked to protect individual privacy. Scored out of 5, as this measures exposure to the hazard only and does not account for duration or impact.
Key Metrics for Job/Systems/People Hazard Insights
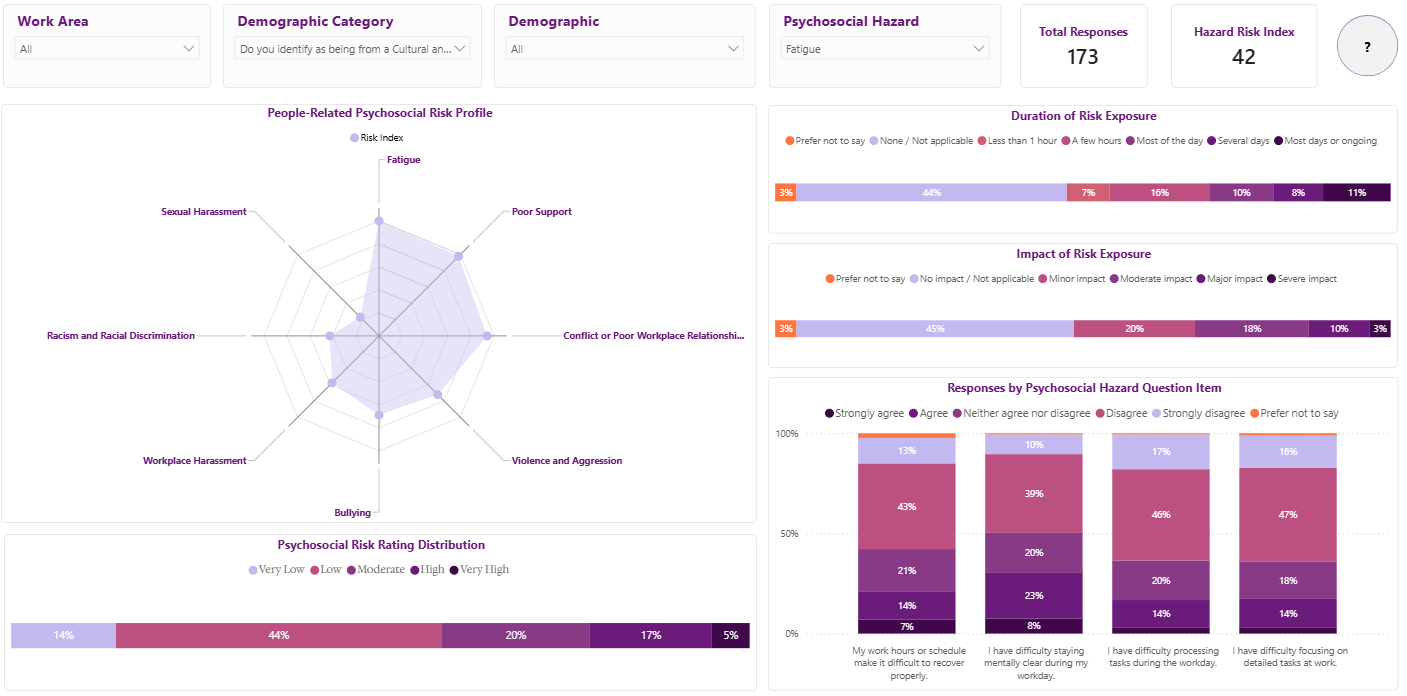
Hazard Risk Index: Shows the risk index for the selected psychosocial hazard, scored out of 100.
Duration of Hazard: Shows the spread of duration related responses for the selected psychosocial hazard.
Impact of Hazard: Shows the spread of impact related responses for the selected psychosocial hazard.
Psychosocial Risk Rating Distribution: Shows the proportion of responses categorised from Very Low to Very High (excluding non-disclosure) for the selected psychosocial hazard.
[Job/Systems/People]-Related Psychosocial Risk Profile: Displays a radar chart of all psychosocial hazards related to the relevant theme, with each hazard's risk index shown out of 100.
Responses by Psychosocial Hazard Question Item: Displays response trends and patterns for each question within the selected psychosocial hazard.
Key Metrics for Workplace Outcomes
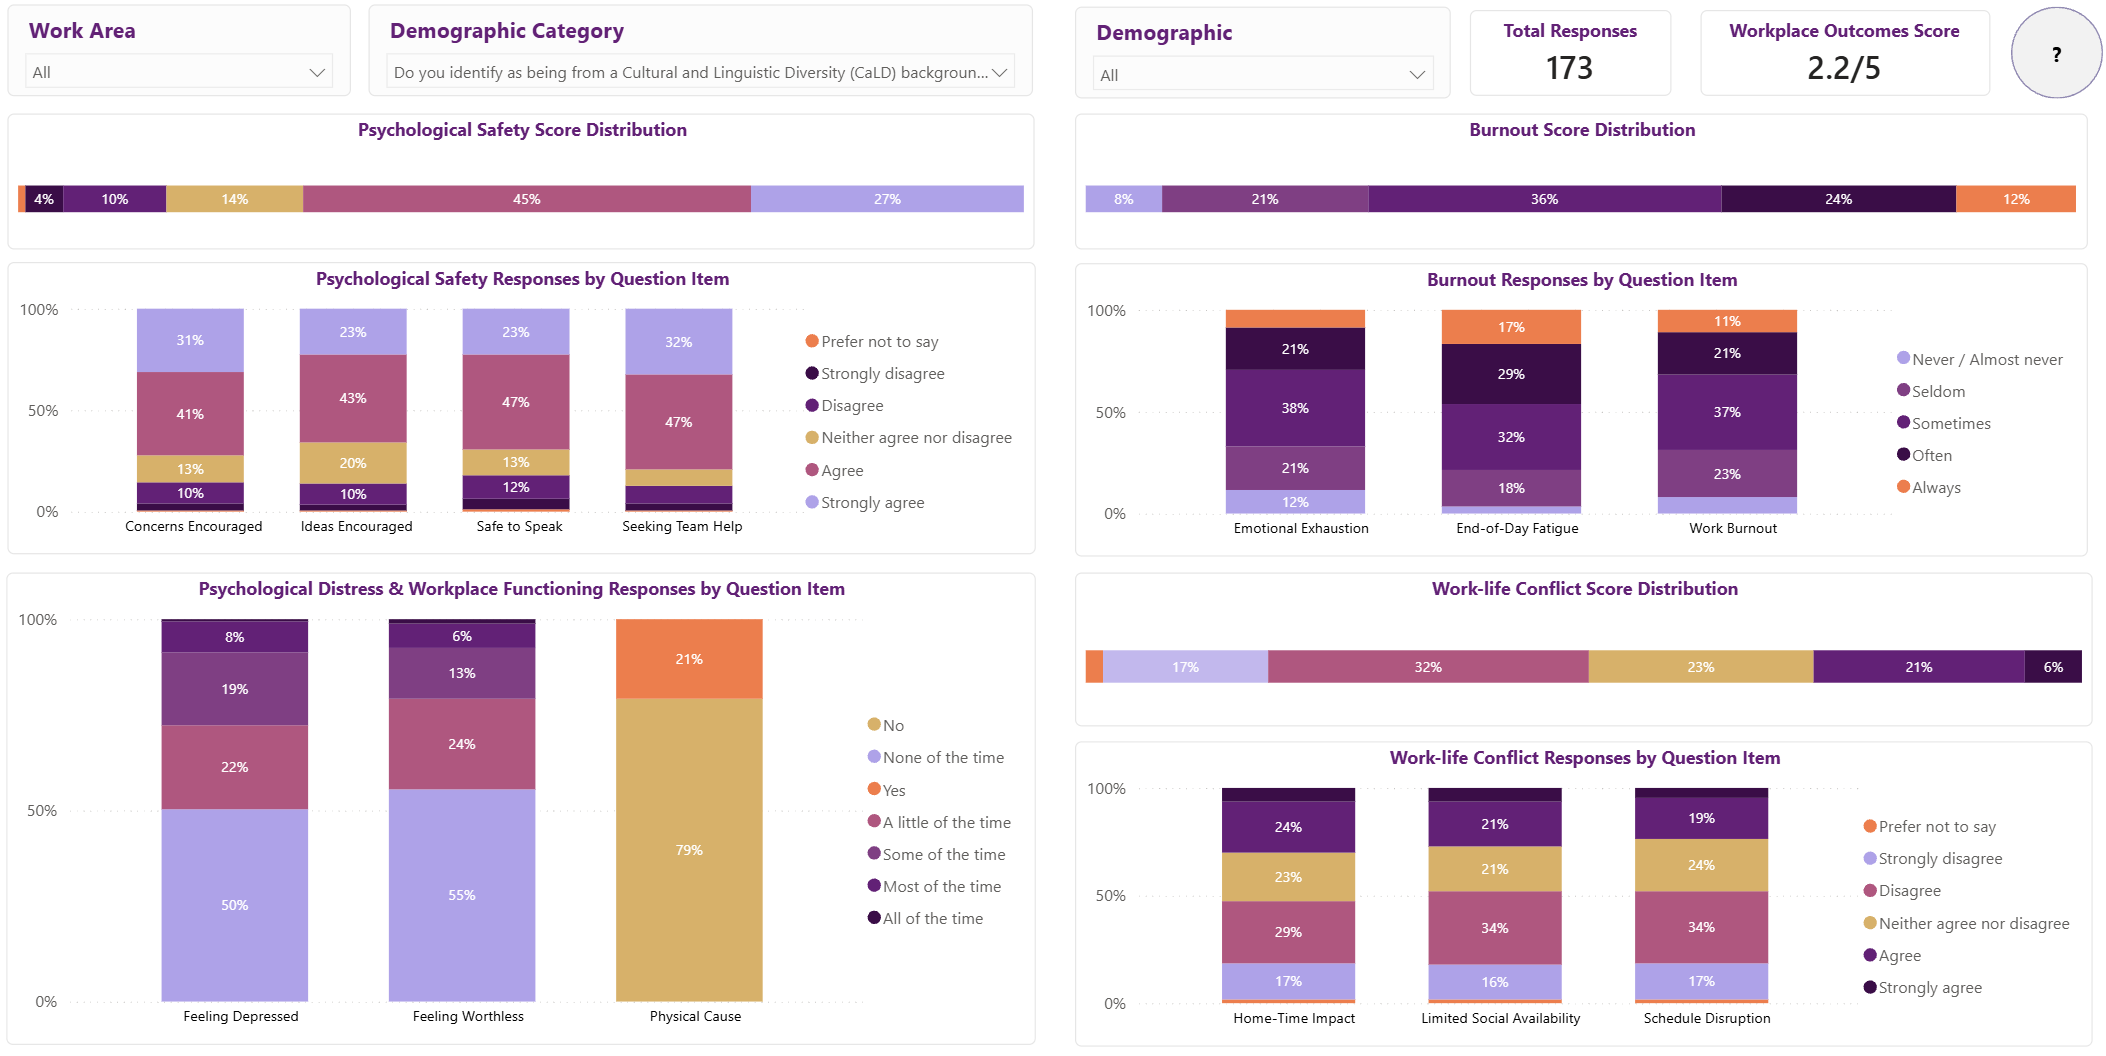
Workplace Outcomes Score: Scored out of 5, as this measures the exposure to the hazard only and does not account for duration or impact of the hazard.
Psychological Safety Score Distribution: Shows the spread of scores across all of the questions related to the additional outcome of Psychological Safety.
Burnout Score Distribution: Shows the spread of scores across all of the questions relating to Burnout additional outcome.
Psychological Safety Responses by Question Item: Displays the response trends and patterns for each question within additional outcome of Psychological Safety.
Psychological Distress & Workplace Functioning Responses by Question Item: Displays the response trends and patterns for each question within additional outcome of Psychological Distress & Workplace Functioning.
Work-life Conflict Score Distribution: Shows the spread of scores across all of the questions related to the additional outcome of Work-life Conflict.
Work-life Conflict Responses by Question Item: Displays the response trends and patterns for each question within additional outcome of Work-life Conflict.
Key Metrics for Hazard Sources & Response Patterns:
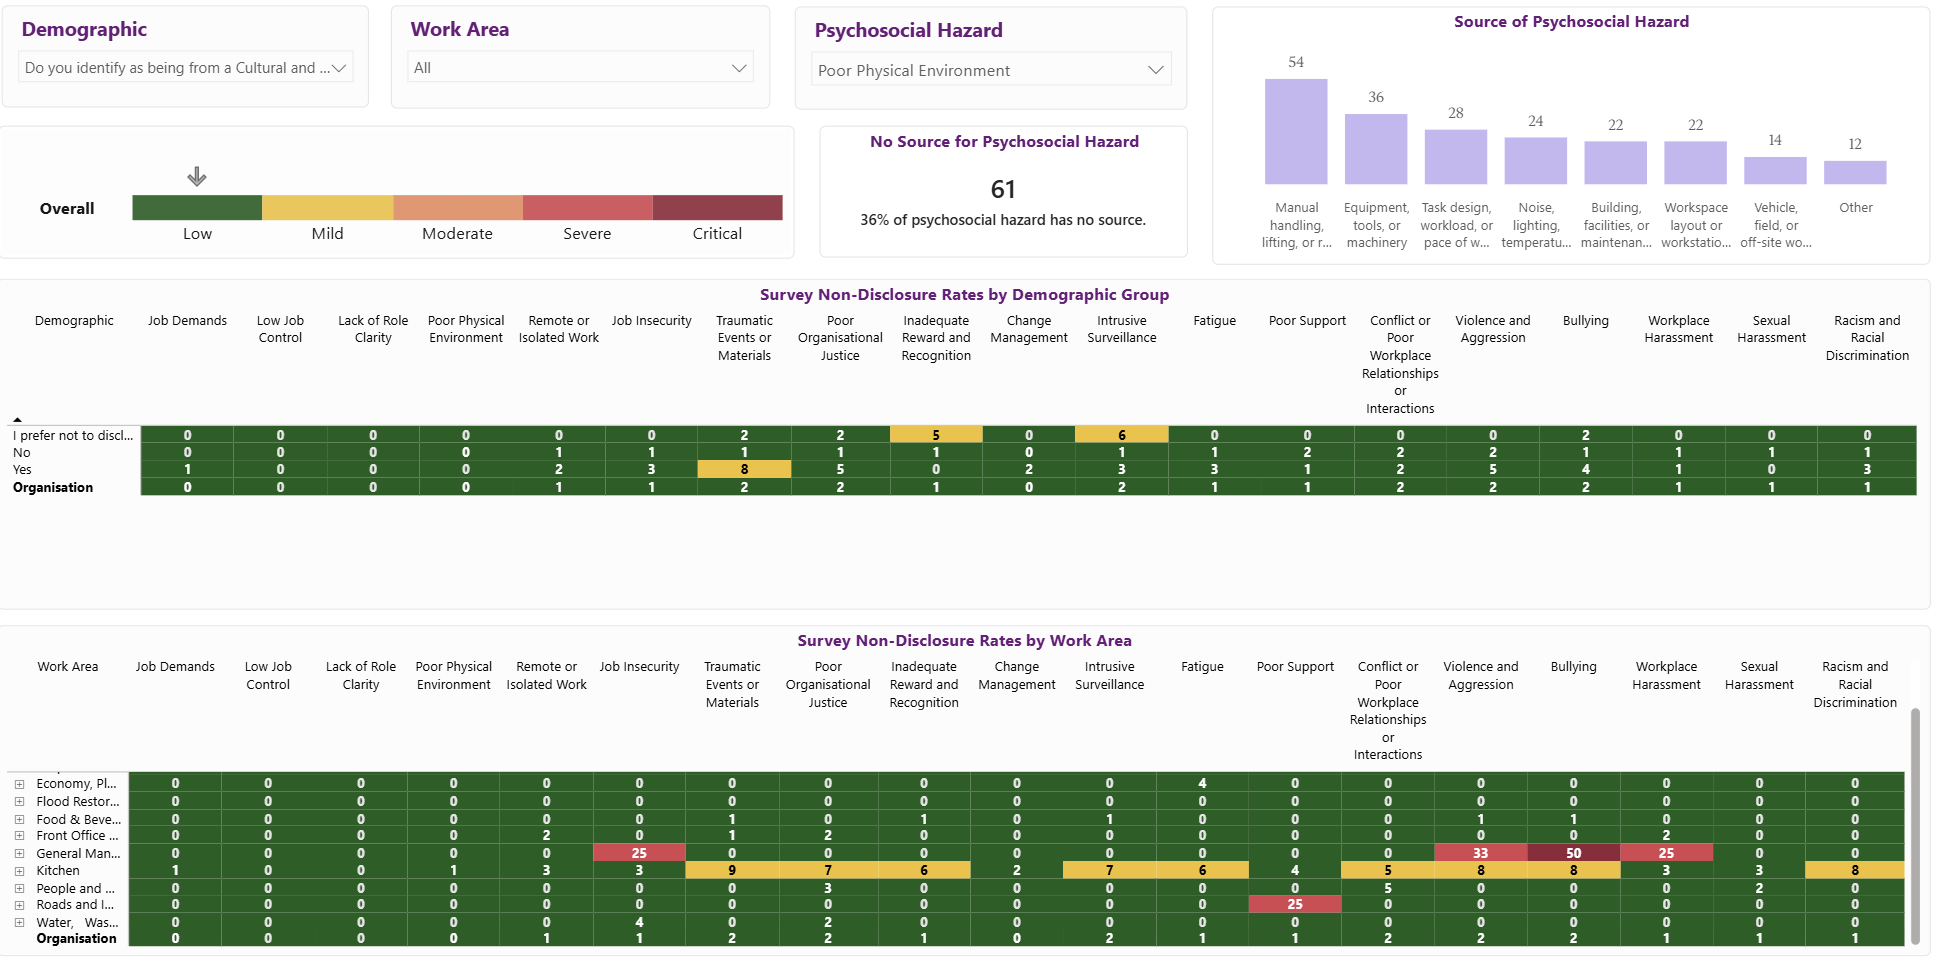
Source of Psychosocial Hazard: A bar chart showing the reported sources of the selected psychosocial hazard exposure which excludes "None".
Survey Non-Disclosure Rates by Demographic Group: A heatmap showing non-disclosure rates across the PRA+ survey, segmented by the selected demographic category.
Survey Non-Disclosure Rates by Work Area: A heatmap showing non-disclosure rates across the PRA+ survey, segmented by the selected work areas.